
AWS | Cloud | Security
Discovering the AWS access you actually need… 
Thijs de Vries 19 Feb, 2020


AWS Elasticsearch Service is a total solution for ingesting, processing and visualizing log data. The service has several use cases. For ad hoc analysis the service is ideal because it is easy to setup, is inexpensive, is easy to operate after you are done you can remove the service. The service can also be used as an operational dashboard, where it continuously ingests, aggregates and visualizes the data. The service can be used as a search backend for web sites, There are many other use cases the service is suitable for. In this blog we will setup a simple ingestion pipeline that ingests a small JSON payload and counts the number of ‘hello’ and ‘bye’ words in a dashboard.
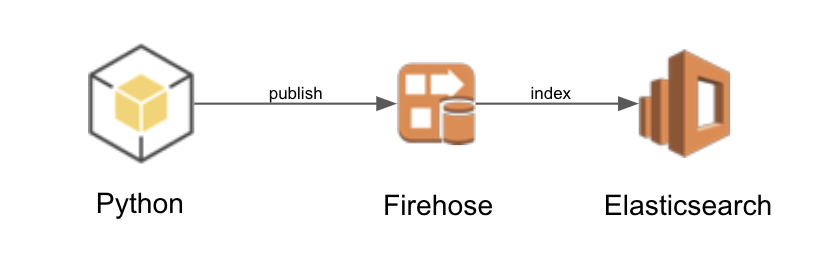
The architecture consists of a Python application that publishes JSON messages to a firehose delivery stream (FDS). The FDS delivers the JSON messages to Elasticsearch (ES) to be indexed. The ES service has a Kibana endpoint that will be used for dashboarding.
Defining an Elasticsearch service
Add the following to CloudFormation to define an ES cluster. The cluster consists of a single node, t2.small.elasticsearch virtual machine, which is the smallest VM the is available to the service.
  ElasticsearchDomain:
    Type: AWS::Elasticsearch::Domain
    Properties:
      ElasticsearchVersion: '6.3'
      ElasticsearchClusterConfig:
        InstanceCount: '1'
        InstanceType: t2.small.elasticsearch
      EBSOptions:
        EBSEnabled: 'true'
        Iops: 0
        VolumeSize: 10
        VolumeType: gp2
      SnapshotOptions:
        AutomatedSnapshotStartHour: '0'
      AccessPolicies:
        Version: 2012-10-17
        Statement:
        - Effect: Allow
          Principal:
            AWS: '*'
          Action: es:*
          Resource: '*'
      AdvancedOptions:
        rest.action.multi.allow_explicit_index: 'true'
Add the following to the CloudFormation template to define a FDS. The ES cluster is the destination for the delivery. The FDS defines wich logs have to be created and when to rotate to a new index OneHour. The FDS uses a lambda to post process the messages just before they are indexed by ES.
  Deliverystream:
    Type: AWS::KinesisFirehose::DeliveryStream
    Properties:
      DeliveryStreamType: DirectPut
      ElasticsearchDestinationConfiguration:
        BufferingHints:
          IntervalInSeconds: 60
          SizeInMBs: 1
        CloudWatchLoggingOptions:
          Enabled: true
          LogGroupName: example-firehose
          LogStreamName: example-firehose
        DomainARN: !GetAtt ElasticsearchDomain.DomainArn
        IndexName: example
        IndexRotationPeriod: OneHour # NoRotation, OneHour, OneDay, OneWeek, or OneMonth.
        RetryOptions:
          DurationInSeconds: 60
        RoleARN: !GetAtt DeliverystreamRole.Arn
        S3BackupMode: AllDocuments
        S3Configuration:
          BucketARN: !GetAtt DestinationBucket.Arn
          BufferingHints:
            IntervalInSeconds: 60
            SizeInMBs: 1
          CompressionFormat: UNCOMPRESSED
          RoleARN: !GetAtt DeliverystreamRole.Arn
        TypeName: example
        ProcessingConfiguration:
          Enabled: true
          Processors:
          - Type: Lambda
            Parameters:
            - ParameterName: LambdaArn
              ParameterValue: !GetAtt ProcessorFunction.Arn
            - ParameterName: RoleArn
              ParameterValue: !GetAtt DeliverystreamRole.Arn
            - ParameterName: NumberOfRetries
              ParameterValue: '3'
            - ParameterName: BufferSizeInMBs
              ParameterValue: '1'
            - ParameterName: BufferIntervalInSeconds
              ParameterValue: '60'

  ProcessorFunctionRole:
    Type: AWS::IAM::Role
    Properties:
      AssumeRolePolicyDocument:
        Statement:
        - Effect: Allow
          Principal:
            Service: lambda.amazonaws.com
          Action: sts:AssumeRole
          Condition: {}
      Path: /
      ManagedPolicyArns:
      - arn:aws:iam::aws:policy/service-role/AWSLambdaBasicExecutionRole
      - arn:aws:iam::aws:policy/AmazonKinesisFirehoseFullAccess

  DeliverystreamRole:
    Type: AWS::IAM::Role
    Properties:
      AssumeRolePolicyDocument:
        Statement:
        - Effect: Allow
          Principal:
            Service: firehose.amazonaws.com
          Action: sts:AssumeRole
          Condition: {}
      Path: /
      Policies:
      - PolicyName: Allow
        PolicyDocument:
          Statement:
          - Effect: Allow
            Action:
            - s3:*
            - kms:*
            - kinesis:*
            - logs:*
            - lambda:*
            - es:*
            Resource:
            - '*'
There are two lambdas to try out. The identity_processor tags every message as being processed so that they can be indexed by ES. The map_message_processor changes the content from hello world to bye world.
indentity_processor.py:
from base64 import b64encode, b64decode
import json

def handler(event, context):
    records = event['records']
    for record in records:
        record.pop('approximateArrivalTimestamp', None)
        record.update({'result': 'Ok'}) # Ok, Dropped, ProcessingFailed
    print(json.dumps(records))
    return {'records': records}
map_message_processor:
from base64 import b64encode, b64decode
import json
import uuid

def handler(event, context):
    records = event['records']
    for record in records:
        record.pop('approximateArrivalTimestamp', None)
        msg = b64encode(bytes(json.dumps({'message': f'bye world! {uuid.uuid4()}'}), 'utf-8')).decode('ascii')
        record.update({'data': msg})
        record.update({'result': 'Ok'}) # Ok, Dropped, ProcessingFailed
    print(json.dumps(records))
    return {'records': records}
The following Python script will publish messages to the FDS.
import boto3
import sys
import json

client = boto3.client('firehose')

stream_name = sys.argv[1]
number_of_messages = int(sys.argv[2])
print(f'Publishing {number_of_messages} to {stream_name}')

records = []

for x in range(1, number_of_messages, 1):
    records.append({
        'Data': bytes(json.dumps({'message': f'hello world {x}'}), 'utf-8')
    })

try:
    response = client.put_record_batch(
        DeliveryStreamName=stream_name,
        Records=records
    )
    if response['FailedPutCount'] > 0:
        print('Error putting messages')

except Exception as e:
    print(f'Error: {e}')

print('Done')
The example project shows how to configure a project to create an elasticsearch cluster for ad-hoc analytics. The example can be deployed with make merge-lambda && make deploy and removed with make delete. To publish messages to the FDS type make publish.
Log into the ‘AWS Console’, then the ‘Elasticsearch service dashboard’, and click on the Kibana URL. Once logged in, click on ‘discover’ and create a new index pattern with the name example-*. Click on ‘discover’ another time and you should see data. If not, type make publish a couple of times in the console to have data available in ES. To search for data type message:bye in the search bar.
Click on ‘visualize’ and click on ‘create visualization’ and choose ‘metric’ to create a counter. Choose the example-* index and click ‘save’ to create this visual. Name it ‘total’. Click on ‘visualize’, then ‘add’, choose ‘metric’, choose example-* and in the filter type message:bye and click ‘save’. Name it ‘bye’. Create another ‘metric’ with the filter ‘message:hello’ and name it ‘hello’.
Click on ‘dashboard’ and ‘create a new dashboard’. Click ‘add’ and then select all three metrics. Click ‘save’ and name the dashboard ‘totals’. Click on auto-refresh and the dashboard should refresh.
By default the example ingests ‘bye world’, due to the processing lambda. lets change that to ‘hello world’, by editing the Makefile and removing the comments from lambdas/identity_processor and commenting lambdas/map_message_processor.py. Type make merge-lambda && make create and the stack should be updated. Next type make publish to publish messages. After a few seconds you should see the dashboard change totals.
In this example we have deployed a Elasticsearch service, ingested data, did some ad-hoc analytics and created a dashboard. Elasticsearch is perfect for analyzing log data like event streams, click streams, access logs, CloudWatch and Cloudtrail logs. Next time we’ll look at processing access logs from API Gateway to get insights how the API is performing.

